You Ask, We Answer
We’re technical experts in the complex and ever-changing world of civil and structural engineering design and technical approval.
What is new in the NaFRA?
The new National Flood Risk Assessment or NaFRA now includes both detailed local and improved national flood risk models regarding current and future flood risk from fluvial, pluvial and surface water.
Key Changes in NaFRA:
1. Greater consistency between local and national flood risk information
2. Additional risk information, including flood depth
3. Finer spatial resolution for flood risk from rivers and sea
4. Future scenarios accounting for climate change
Lead Local Flood Authorities were invited to review the draft version of the new flood risk maps.
The climate change allowances that have been included in the new flood maps are:
1. Risk of Flooding from Rivers & Sea
- The ‘Central’ allowance for the 2050s period (2040-2060) for risk of flooding from rivers
- The ‘Higher Central’ allowance for risk of flooding from the sea, accounting for cumulative sea level rise to 2065
2. Risk of Flooding from Surface Water
- Central’ allowance for the 2050s period (2040-2060)
What does that mean for my already submitted NaFRA application?
Any planning applications already submitted and validated should be reviewed against the information available at the time of the validation. However, we would not be surprised if the LLFA request during consultation responses or at the discharge of condition phase that the drainage strategy and flood assessment are updated for the new flood risk maps.
We suggest that each site is reviewed to understand the impact of any change.
What does that mean for new applications?
In reality significant changes are not anticipated as the impact of climate change should have already been considered as the updated flood maps are not changes to legislation or NPPF. With the new maps it gives us an improved visual representation of the risk. The new maps should be used in all future assessment work.
Technical bit for the engineers
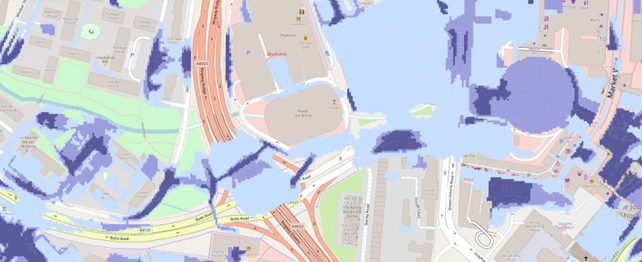
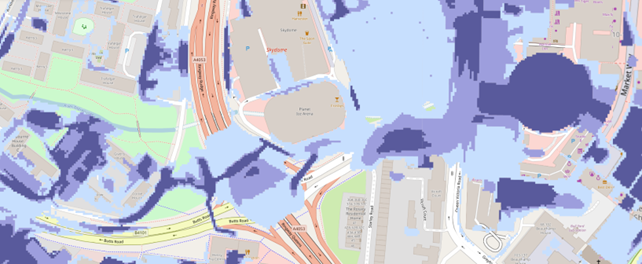
The flood risk maps now have been broken-down in depth ranges of 0.2, 0.3, 0.6, 0.9 and 1.2m at a 2m resolution grid.
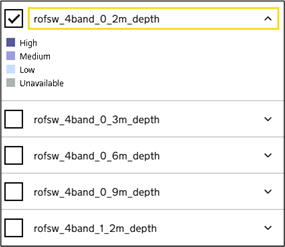
Each flood depth range shows the likelihood of flooding during different events:
- High – greater than or equal to 3.3% chance in any given year (1 in 30)
- Medium – less than 3.3% (1 in 30) but greater than or equal to 1% (1 in 100) chance in any given year
- Low – less than 1% (1 in 100) chance in any given year
It is a change to have the return periods under each flood depth range as previously we have been used to seeing the Flood depths range together under a certain return period.